Why Oil Ignores the Headlines
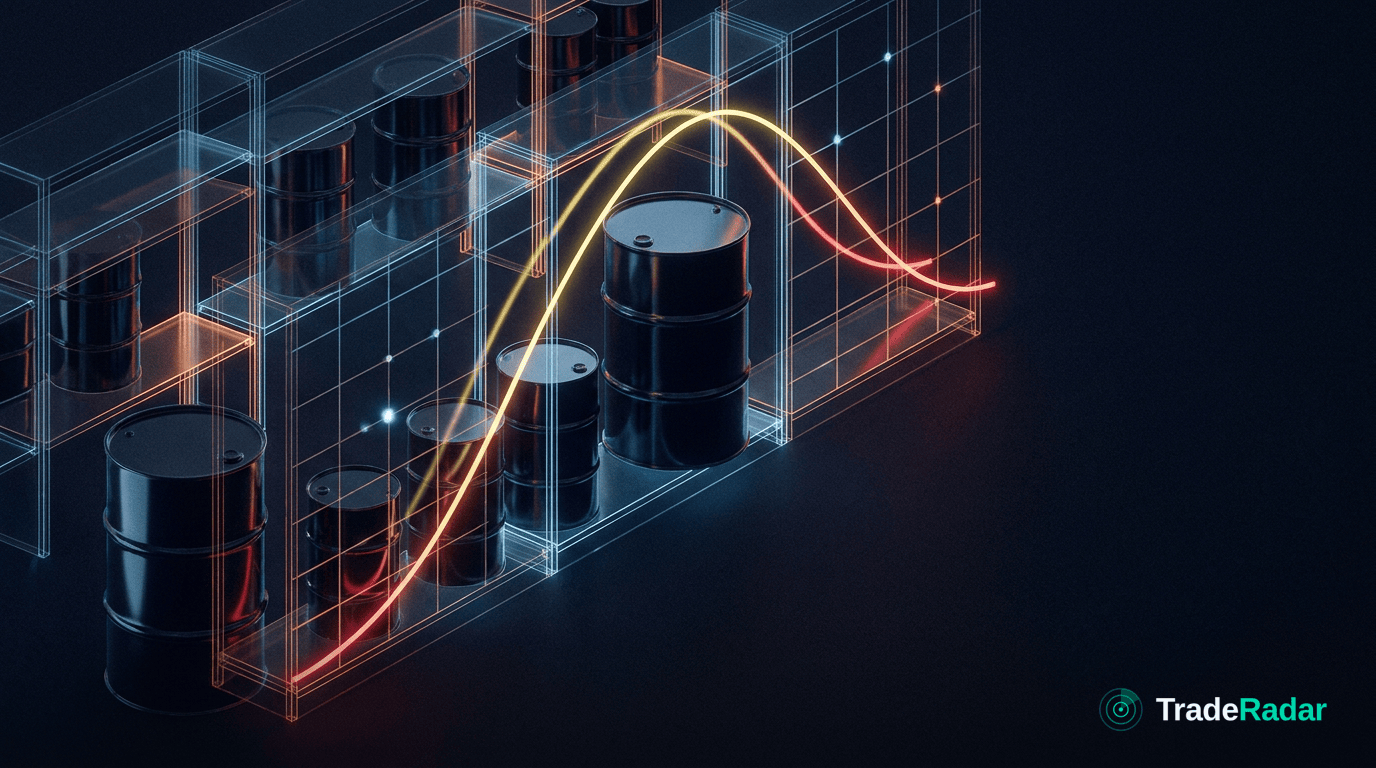
Oil looks like a headline-driven market — wars, pipelines, sanctions — yet it often shrugs those off and moves on two quieter numbers: inventories and the shape of the futures curve. In short, oil is a market about physical barrels, and the barrels are counted. This guide explains the mechanism in plain English, so the next time crude doesn't react the way the news suggests, you can see why.
Oil is a physical market, not a story
Crude oil trades on the balance between how much is being produced, how much is being consumed, and how much is sitting in storage right now. A dramatic headline only moves the price to the extent it changes that physical balance — actual barrels flowing to actual buyers.
That's why a frightening geopolitical event can pass with barely a ripple: if no barrels were lost, nothing changed for the balance. And it's why a dull-sounding storage report can send crude sharply higher or lower — because it directly updates the count of available supply.
Inventories: the market's scorecard
Inventories are the running tally of crude and refined products in storage. They're the single cleanest read on whether the market is tight (supply struggling to meet demand) or loose (supply comfortably ahead of demand).
- A larger-than-expected build in stocks signals softer demand or ample supply — usually bearish for price.
- A larger-than-expected draw signals stronger demand or tighter supply — usually bullish.
Crucially, what matters is the number versus expectations, not the raw figure. The market already has a forecast baked in; the move comes from the surprise. This is why oil can fall on an inventory draw — if the draw was smaller than everyone expected, the surprise was bearish.
The futures curve: contango and backwardation
Oil doesn't have one price; it has a whole ladder of prices for delivery in each future month. The shape of that ladder — the curve — tells you how tight the market feels.
- Backwardation: near-term prices are higher than later-dated ones. This is the signature of a tight market — buyers are paying a premium for barrels now, because they need them now.
- Contango: near-term prices are lower than later-dated ones. This is the signature of a well-supplied market — nobody's desperate for immediate barrels, and future delivery even carries a storage premium.
The curve's shape is a physical-tightness gauge you can read at a glance. A market flipping from contango into backwardation is telling you supply is tightening, often before the flat price makes it obvious.
Why the curve matters even if you never trade it
Even if you only ever watch a single crude price, the curve is quietly shaping it. Backwardation tends to reward simply holding a long position as contracts roll forward; contango tends to erode it. That "roll" is a big reason a crude-linked position can drift away from the headline spot price over time — a mechanic that surprises people who only watch the front number.
Demand: the slow-moving other half
Supply gets the headlines, but demand sets the backdrop. Oil demand tracks the health of the global economy — industrial activity, transport, travel. So macro signals matter:
- A strengthening global growth outlook lifts expected demand and tends to support prices.
- Recession fears, weak manufacturing data, or a strong US dollar (oil is priced in dollars) tend to weigh on prices.
Demand moves slowly and is hard to see day to day, which is why inventories and the curve — faster, more concrete signals — often dominate the short-term price action.
What breaks this
No framework is a law, and honesty about the exceptions is part of using it well:
- Real supply shocks are different. When a headline actually removes barrels — a genuine outage, a blockade that stops flows, a meaningful production cut — oil does respond, because now the physical balance really has changed. The rule isn't "ignore geopolitics"; it's "geopolitics matters only when it moves barrels."
- Fear premiums come and go. Markets sometimes price a "risk premium" for the threat of disruption, then unwind it when the threat passes. That can look like oil moving on nothing.
- Financial flows. Large positioning shifts by funds can push price around the physical fundamentals for stretches, especially in quieter periods.
- Data noise. Weekly inventory figures are volatile and get revised. One print is a data point, not a trend.
When oil moves against the barrels — rising on a build, or ignoring an outage — that's a signal a different driver (a risk premium, positioning, or the macro backdrop) has taken over.
How to actually use this
You don't need to forecast crude. You need to watch its real drivers:
- Inventories versus expectations — the tight-or-loose scorecard.
- The curve's shape — backwardation (tight) versus contango (loose).
- The demand backdrop — global growth signals and the dollar.
When someone asks "why is oil up today?", the useful answer is usually some version of: stocks drew more than expected and the curve is in backwardation — or the reverse. Direction with a reason beats direction alone.
Want the whole board this way — every market with its drivers, not just its price? That's what TradeRadar is built to do: see what's moving and why, across assets, in one view.
TradeRadar is decision-support software, not investment advice. Trading involves risk.
Frequently asked
Why does oil sometimes ignore war and geopolitical headlines?
Oil is a physical market that moves on the balance of barrels. A headline only moves price if it actually changes supply or demand. If no barrels are lost, the physical balance is unchanged — so crude can shrug off frightening news that doesn't touch the flow of oil.
What are oil inventories and why do they matter?
Inventories are the running count of crude and product held in storage — the cleanest read on whether the market is tight or loose. Prices react to the surprise versus expectations: a bigger-than-expected build is usually bearish, a bigger-than-expected draw usually bullish.
What's the difference between contango and backwardation?
Backwardation means near-term prices are higher than later-dated ones — the signature of a tight, in-demand market. Contango means near-term prices are lower than later ones — the signature of a well-supplied market. The curve's shape is a physical-tightness gauge.
Does the futures curve affect a crude position even if I don't trade the curve?
Yes. As contracts roll forward, backwardation tends to help a long position and contango tends to erode it. That "roll" is a key reason a crude-linked position can drift away from the headline spot price over time.
Related in Macro & Technical

Contango vs Backwardation: What the Futures Curve Tells You
The futures curve tells you how tight a market feels before the flat price does. Here's contango vs backwardation in plain English — and what breaks the read.
Copper: the Growth Barometer They Call Dr Copper
Copper is called Dr Copper because its price reads the health of the global economy. Here's the plain-English mechanism — and what breaks the signal.
EUR/USD and Central-Bank Divergence
EUR/USD is a tug-of-war between two central banks. Here's the plain-English mechanism — how rate divergence drives the pair, and what breaks it.